Nikkei 225 closed at 68,309 (-647). Put/call ratio 2.717 (prev 1.43). Heaviest open interest near spot: call 72,000, put 65,000.
2.717#4 highest of 51 days since Jul 17
40,387#2 highest of 51 days since Jul 17
14,862#26 highest of 51 days since Jul 17
22.6 (-0.3)#243 highest of the last 250 trading days
179 M sh (-3%)
10/9 Options SQ・in 5d
What do these numbers mean? → Put/call ratio ・ Gamma exposure ・ Nikkei options field guide
Market Overview


Options Open Interest by Expiry
The nearest three expiries, as published daily by JPX. The back month is sometimes larger than the front. (→ Field guide ・ → SQ explained)
Strikes within ±3,000 yen of the previous close (65,309–71,309). Nearest 3 expiries published daily by JPX. Change is day-over-day.
Left: Open Interest (green = largest per expiry) / Right: DoD Change (increase = green, decrease = red)
Open interest (green = largest per expiry)
| Strike | Call | Put | ||||
|---|---|---|---|---|---|---|
| Oct 2026 | Nov 2026 | Dec 2026 | Oct 2026 | Nov 2026 | Dec 2026 | |
| 71,250 | 147 | 6 | - | - | - | - |
| 71,125 | 3 | 2 | - | - | - | - |
| 71,000 | 1,905 | 1,336 | 2,063 | 1 | - | 31 |
| 70,875 | 2 | - | - | - | - | - |
| 70,750 | 292 | 4 | - | 0 | 160 | - |
| 70,625 | 24 | - | - | - | - | - |
| 70,500 | 440 | 30 | 1 | 0 | - | - |
| 70,375 | 128 | 102 | - | - | - | - |
| 70,250 | 53 | 119 | - | 4 | - | - |
| 70,125 | 5 | - | - | - | - | - |
| 70,000 | 2,716 | 1,334 | 5,333 | 114 | 571 | 1,653 |
| 69,875 | 118 | 16 | - | - | - | - |
| 69,750 | 154 | 1 | - | 1 | - | - |
| 69,625 | 99 | - | - | - | - | - |
| 69,500 | 499 | 16 | - | 1 | 1 | - |
| 69,375 | 3 | 118 | - | - | - | - |
| 69,250 | 36 | - | 50 | 2 | - | - |
| 69,125 | 7 | - | - | - | - | - |
| 69,000 | 2,647 | 3,862 | 1,721 | 256 | 473 | 1,645 |
| 68,875 | 159 | 25 | - | 0 | - | - |
| 68,750 | 375 | 10 | - | 17 | - | 100 |
| 68,625 | 1 | 1 | - | 62 | - | - |
| 68,500 | 1,472 | 15 | 437 | 154 | 157 | 206 |
| 68,375 | 14 | 16 | - | 61 | 16 | - |
| ▶ Prev. close 68,309 | ||||||
| 68,250 | 123 | - | - | 207 | - | - |
| 68,125 | 68 | - | - | 1 | - | - |
| 68,000 | 2,290 | 626 | 4,314 | 732 | 208 | 1,900 |
| 67,875 | 21 | 1 | - | - | - | - |
| 67,750 | 1,050 | 35 | - | 130 | 1 | - |
| 67,625 | 94 | - | - | 6 | - | - |
| 67,500 | 887 | 929 | 25 | 289 | 4 | 25 |
| 67,375 | 82 | - | - | 0 | - | - |
| 67,250 | 64 | - | 25 | 26 | 0 | 25 |
| 67,125 | 55 | - | - | 0 | 0 | - |
| 67,000 | 1,546 | 1,440 | 2,237 | 1,492 | 936 | 1,607 |
| 66,875 | 35 | - | - | 5 | - | - |
| 66,750 | 151 | 6 | - | 35 | 0 | - |
| 66,625 | 66 | - | - | - | 0 | - |
| 66,500 | 293 | 1 | 2,984 | 558 | 441 | 1,100 |
| 66,375 | 95 | - | - | 2 | - | - |
| 66,250 | 86 | 1 | 18 | 163 | - | - |
| 66,125 | 35 | 4 | - | 86 | - | - |
| 66,000 | 2,993 | 669 | 1,092 | 1,694 | 1,820 | 1,136 |
| 65,875 | 84 | 50 | - | 19 | - | - |
| 65,750 | 135 | 1 | 15 | 173 | 0 | 15 |
| 65,625 | 31 | - | - | 5 | - | - |
| 65,500 | 258 | 209 | 734 | 592 | 135 | 605 |
| 65,375 | 7 | 11 | - | 247 | 30 | - |
Day-over-day change (increase = green, decrease = red)
| Strike | Call | Put | ||||
|---|---|---|---|---|---|---|
| Oct 2026 | Nov 2026 | Dec 2026 | Oct 2026 | Nov 2026 | Dec 2026 | |
| 71,250 | -9 | 0 | - | - | - | - |
| 71,125 | +1 | 0 | - | - | - | - |
| 71,000 | -66 | +3 | -50 | 0 | - | 0 |
| 70,875 | 0 | - | - | - | - | - |
| 70,750 | -3 | 0 | - | 0 | 0 | - |
| 70,625 | -1 | - | - | - | - | - |
| 70,500 | +10 | 0 | 0 | 0 | - | - |
| 70,375 | -1 | 0 | - | - | - | - |
| 70,250 | +5 | 0 | - | 0 | - | - |
| 70,125 | -2 | - | - | - | - | - |
| 70,000 | -13 | +221 | -75 | 0 | -99 | 0 |
| 69,875 | 0 | 0 | - | - | - | - |
| 69,750 | +29 | 0 | - | 0 | - | - |
| 69,625 | 0 | - | - | - | - | - |
| 69,500 | -43 | 0 | - | 0 | 0 | - |
| 69,375 | 0 | 0 | - | - | - | - |
| 69,250 | -4 | - | 0 | 0 | - | - |
| 69,125 | 0 | - | - | - | - | - |
| 69,000 | -207 | -5 | 0 | +1 | 0 | 0 |
| 68,875 | 0 | 0 | - | 0 | - | - |
| 68,750 | 0 | 0 | - | +1 | - | 0 |
| 68,625 | 0 | +1 | - | 0 | - | - |
| 68,500 | -12 | 0 | 0 | +22 | -25 | 0 |
| 68,375 | 0 | 0 | - | 0 | 0 | - |
| ▶ Prev. close 68,309 | ||||||
| 68,250 | +5 | - | - | +199 | - | - |
| 68,125 | -2 | - | - | +1 | - | - |
| 68,000 | -3 | +1 | 0 | -103 | +1 | 0 |
| 67,875 | 0 | 0 | - | - | - | - |
| 67,750 | -9 | 0 | - | -4 | 0 | - |
| 67,625 | 0 | - | - | 0 | - | - |
| 67,500 | -252 | 0 | 0 | +18 | 0 | 0 |
| 67,375 | -1 | - | - | 0 | - | - |
| 67,250 | -2 | - | 0 | 0 | 0 | 0 |
| 67,125 | 0 | - | - | 0 | 0 | - |
| 67,000 | -21 | +4 | 0 | +246 | +36 | +10 |
| 66,875 | 0 | - | - | 0 | - | - |
| 66,750 | 0 | 0 | - | +7 | 0 | - |
| 66,625 | 0 | - | - | - | 0 | - |
| 66,500 | 0 | 0 | 0 | +256 | 0 | 0 |
| 66,375 | 0 | - | - | 0 | - | - |
| 66,250 | 0 | 0 | +3 | +11 | - | - |
| 66,125 | 0 | 0 | - | 0 | - | - |
| 66,000 | -210 | 0 | 0 | +403 | +1 | 0 |
| 65,875 | 0 | 0 | - | 0 | - | - |
| 65,750 | 0 | 0 | 0 | -2 | 0 | 0 |
| 65,625 | 0 | - | - | 0 | - | - |
| 65,500 | -2 | 0 | 0 | +278 | 0 | 0 |
| 65,375 | 0 | 0 | - | 0 | 0 | - |
Open Interest Distribution by Strike
Strikes with heavy open interest often act as reference levels ("walls"). The largest open interest in the chain is usually a far out-of-the-money legacy position, so look near spot. (→ Why) Includes mini options (27,781 contracts) converted to large-equivalent (1/10).

Mini Options OI (Weekly: 10/8 expiry)
Open interest by strike for Nikkei 225 mini options (weekly expiries) — a gauge of short-term battle lines. (→ Field guide)

Gamma Exposure
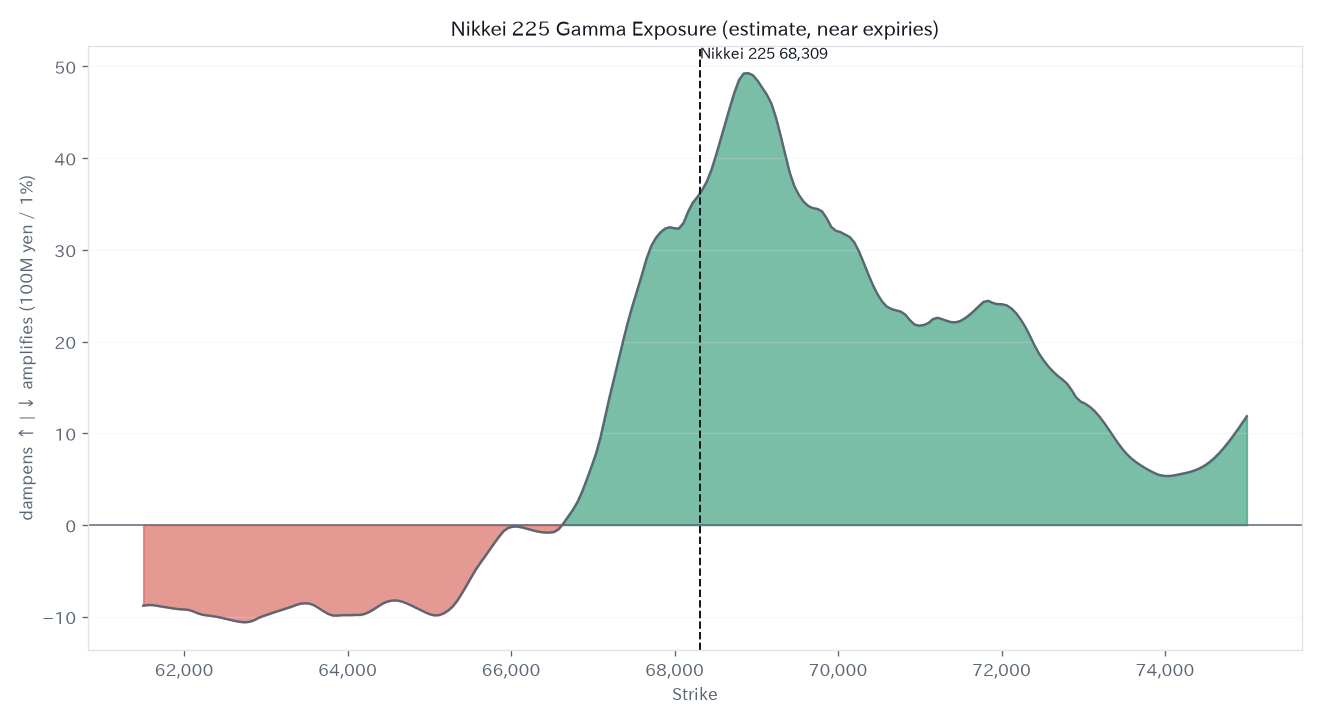
Dealers who sold options hedge by trading futures. Depending on where the index sits, that hedging can either dampen or amplify moves. The chart below estimates that force by strike, using open interest and the implied volatility in JPX settlement prices. Actual dealer positions are not disclosed, so this is an estimate (assuming dealers are long calls and short puts).
Above spot +1,139, below spot -48 (100M yen). Net: dampening moves (+1,091 per 1% move).
Implied Volatility by Strike
The Nikkei VI compresses the whole surface into one number, so it cannot tell you which side of the market is paying up for protection. JPX publishes implied volatility for every strike in its daily settlement file, so we plot puts below spot and calls above it. Deep in-the-money contracts print a placeholder 1.0%, so only out-of-the-money strikes are used.
At-the-money implied volatility is 23.1%. Ten percent below spot prices at 35.9%, ten percent above at 26.1%.
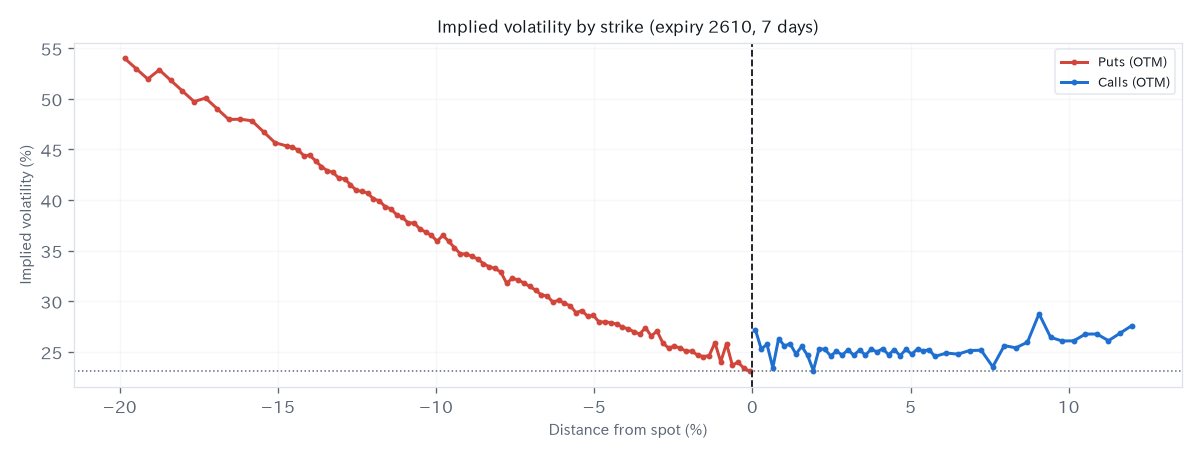
A steeper left side means downside protection is more expensive. This is the same volatility that feeds our gamma estimates. (→ how to read it)
Futures Volume (large-equivalent comparison)
Mini is 1/10 the notional of the large contract; micro is 1/100. Raw contract counts are not comparable, so a large-equivalent column is shown. (→ Glossary)
| Product | Volume (contracts) | Large-equiv | Turnover |
|---|---|---|---|
| 日経225先物 | 42,027 | 42,027 | 2.88 tn yen |
| 日経225mini | 682,130 | 68,213 | 4.67 tn yen |
| 日経225マイクロ先物 | 949,630 | 9,496 | 0.65 tn yen |
| Total | - | 119,736 | 8.19 tn yen |
Trading Volume by Participant (daily ranking)
Volume only — this says nothing about direction. It shows which firms are active. (→ How to read it)
Trading date: 2026/10/02 (published by JPX at 2026/10/02 17:41). Volume and share by participant. Direction is not disclosed, but it shows who is most active.
日経225先物
| Participant | Volume | Share |
|---|---|---|
| ABNクリアリン証券 | 9,973 | 27.0% |
| ソシエテG証券 | 8,611 | 23.3% |
| バークレイズ証券 | 4,392 | 11.9% |
| 野村証券 | 1,746 | 4.7% |
| ゴールドマン証券 | 1,732 | 4.7% |
| サスケハナ・ホンコン | 1,566 | 4.2% |
| JPモルガン証券 | 1,213 | 3.3% |
| モルガンMUFG証券 | 1,089 | 2.9% |
| 三菱UFJ証券 | 981 | 2.7% |
| ドイツ証券 | 811 | 2.2% |
日経225mini
| Participant | Volume | Share |
|---|---|---|
| ABNクリアリン証券 | 181,151 | 35.1% |
| ソシエテG証券 | 114,072 | 22.1% |
| バークレイズ証券 | 85,343 | 16.5% |
| SBI証券 | 26,706 | 5.2% |
| 楽天証券 | 18,977 | 3.7% |
| 松井証券 | 16,795 | 3.3% |
| サスケハナ・ホンコン | 12,161 | 2.4% |
| 日産証券 | 10,964 | 2.1% |
| JPモルガン証券 | 7,271 | 1.4% |
| 三菱UFJeスマート | 6,159 | 1.2% |
Participants by Type (Foreign / Domestic / Online)
JPX names each participant, which only helps if you know the firms. Here they are grouped into foreign brokers, domestic brokers and online brokers (retail order flow), with Nikkei 225 futures and minis combined on a large-contract basis. Positive is net long. Comparing to zero is meaningless — every group carries a structural bias, so compare each to its own normal.
| Type | Net OI | WoW | 52w avg | Correlation |
|---|---|---|---|---|
| Foreign | -15,473 | +2,551 | -6,176 | +0.35 |
| Domestic | +17,917 | -1,847 | +6,897 | -0.25 |
| Online (retail) | -2,595 | -780 | -872 | -0.42 |
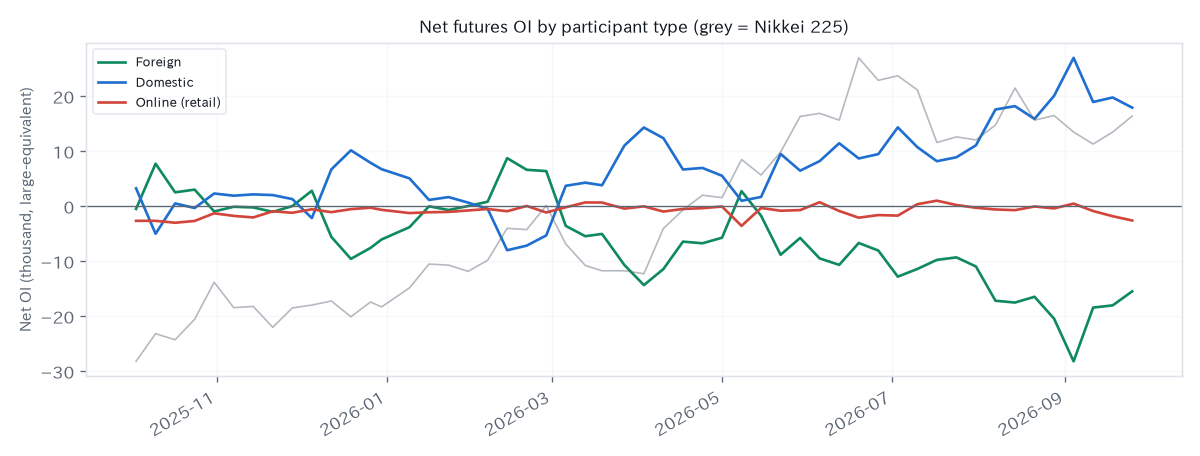
The correlation column shows how often a group’s weekly position change moved with the Nikkei (+1 = always the same direction). Groupings are ours; Japanese joint ventures such as Mitsubishi UFJ Morgan Stanley count as domestic.
Futures Open Interest by Trading Participant (Weekly)
Bars: weekly net open interest per participant (green = net long, red = net short). Gray line: Nikkei 225 (shape only, no scale). Top 12 participants by latest position size. Comparing against zero is useless — compare each firm against its own baseline. (→ How to read it)

As of 2026/09/25 (weekly data published on the first business day of each week; WoW = one-week change in net open interest)
Nikkei 225 Futures + mini (large-equivalent) — Top Net Sellers
| Participant | Net OI | WoW |
|---|---|---|
| HSBC証券 | -31,500 | +0 |
| ゴールドマン証券 | -10,407 | +132 |
| モルガンMUFG証券 | -9,902 | -539 |
| 三菱UFJ証券 | -7,529 | -669 |
| みずほ証券 | -5,211 | -211 |
| BNPパリバ証券 | -4,011 | +20 |
| SBI証券 | -2,870 | -878 |
| ナティクシス証券 | -654 | -1 |
Nikkei 225 Futures + mini (large-equivalent) — Top Net Buyers
| Participant | Net OI | WoW |
|---|---|---|
| 野村証券 | +33,162 | -604 |
| バークレイズ証券 | +8,448 | +97 |
| UBS証券 | +5,930 | -802 |
| SMBC日興証券 | +5,217 | +123 |
| シティグループ証券 | +4,810 | -324 |
| ドイツ証券 | +4,566 | +835 |
| ビーオブエー証券 | +3,532 | -430 |
| ソシエテG証券 | +2,782 | +127 |
Nikkei 225 Futures — Top Net Sellers
| Participant | Net OI | WoW |
|---|---|---|
| HSBC証券 | -31,500 | +0 |
| ゴールドマン証券 | -13,374 | +131 |
| モルガンMUFG証券 | -9,901 | -539 |
| 三菱UFJ証券 | -7,529 | -669 |
| みずほ証券 | -5,211 | -211 |
| SBI証券 | -2,919 | -877 |
| ナティクシス証券 | -654 | -1 |
| JPモルガン証券 | -643 | +744 |
Nikkei 225 Futures — Top Net Buyers
| Participant | Net OI | WoW |
|---|---|---|
| 野村証券 | +33,261 | -605 |
| バークレイズ証券 | +8,380 | +98 |
| SMBC日興証券 | +4,917 | +123 |
| シティグループ証券 | +4,811 | -324 |
| ドイツ証券 | +4,570 | +829 |
| UBS証券 | +4,505 | -852 |
| ビーオブエー証券 | +3,882 | -410 |
| ソシエテG証券 | +3,073 | +168 |
Nikkei 225 mini Futures — Top Net Sellers
| Participant | Net OI | WoW |
|---|---|---|
| BNPパリバ証券 | -45,251 | +4 |
| ビーオブエー証券 | -3,495 | -200 |
| ソシエテG証券 | -2,907 | -411 |
| 野村証券 | -986 | +7 |
| ドイツ証券 | -35 | +63 |
| マネックス証券 | -32 | -97 |
| インタラクティブ証券 | -21 | -16 |
| 日産証券 | -20 | -63 |
Nikkei 225 mini Futures — Top Net Buyers
| Participant | Net OI | WoW |
|---|---|---|
| ゴールドマン証券 | +29,668 | +9 |
| UBS証券 | +14,250 | +500 |
| SMBC日興証券 | +3,000 | +0 |
| ABNクリアリン証券 | +2,167 | +491 |
| JPモルガン証券 | +1,949 | -50 |
| バークレイズ証券 | +675 | -12 |
| SBI証券 | +485 | -7 |
| 松井証券 | +299 | +36 |
Foreign Investor Flows (Weekly)
Weekly net buying by foreign investors in TSE Prime cash equities, shown as a cumulative line (top) and weekly bars (bottom), from JPX trading-by-investor-type data. Positive = net buying. Latest week (2026-09 W2): -0.27 tn / cumulative since 2021: +18.17 tn yen

Put/Call Ratio Trend
Above 1.0 = puts dominant; below 1.0 = calls dominant. 1.0 is not the neutral line — the measured average is 1.57 for large contracts. (→ Full explanation)

Guides — How to Read This Data
Background on each indicator and how traders actually use it.
Contract basics, SQ, and what the official data covers Where to Get Nikkei 225 Data
Every official file, its exact name, when it publishes and what breaks parsers Contract Specifications
Multiplier x JPY 1,000 (mini x 100), European, cash settled at SQ Implied Volatility by Strike
298 strikes on one day: 25.0% at the money, 50.2% fifteen percent below Gamma Exposure, Honestly
What it measures, and the two errors that inflate most published estimates The Gamma Flip Level
Absent on 16 of 34 sessions — when the level matters and when it is noise The Put/Call Ratio Trap
Why it falls on some of the worst down days, and how to read it instead Nikkei SQ Explained
Open interest climbs into expiry, then vanishes in one session JPX Participant Positioning
Japan's hidden COT — weekly futures positions by named firm Glossary
SQ, genkyoku, tategyoku, teguchi — and the JPX file each comes from